This is the Midas PDB file viewer generated (using the scripts
show_chains.pl)
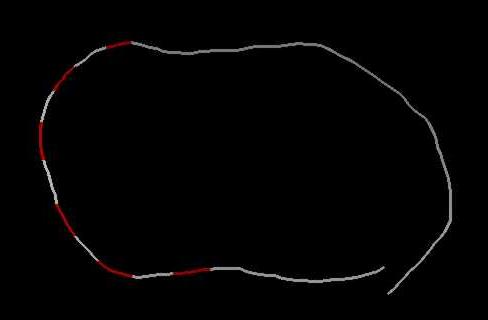
graphical view of one of the successful cyclizing molecules.
The B-form region of the DNA is colored white and the Atract region
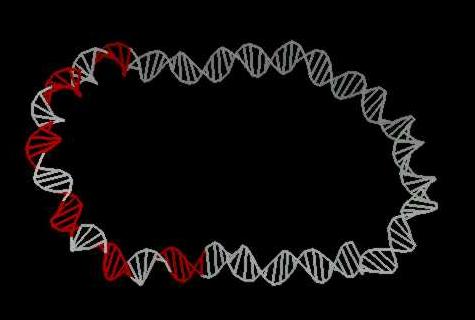
is colored red. The second picture is simply the "wire view"
of the first picture.
bass (lapham):> show_chains sequence.in chain_cyclized.dat 1
bass (lapham):> rotmat2pdb.pl chain_1.rotmat
bass (lapham):> midas chain_1.pdb
bass (lapham):> show_chains sequence.in chain_cyclized.dat 1
bass (lapham):> rotmat2pdb.pl wire chain_1.rotmat
bass (lapham):> midas chain_1.pdb