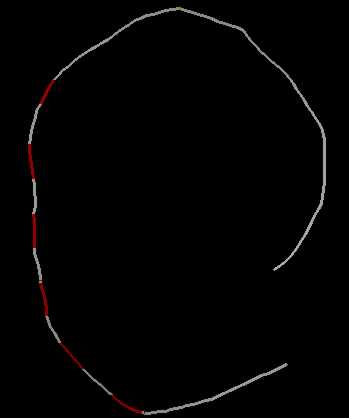
This is the Midas PDB file viewer generated (using the scripts
show_chains.pl and rotmat2pdb.pl)
graphical view of one of the in phase cyclized molecules.
The B-form region of the DNA is colored white and the Atract region
is colored red, the two bends are represented by yellow.
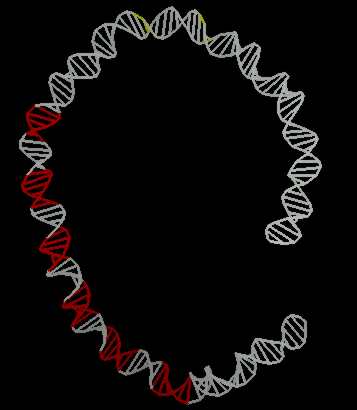
The second picture is simply the "wire view"
of the first picture.
bass (lapham):> show_chains sequence.in chain_cyclized.dat 1
bass (lapham):> rotmat2pdb.pl chain_1.rotmat
bass (lapham):> midas chain_1.pdb
bass (lapham):> show_chains sequence.in chain_cyclized.dat 1
bass (lapham):> rotmat2pdb.pl wire chain_1.rotmat
bass (lapham):> midas chain_1.pdb